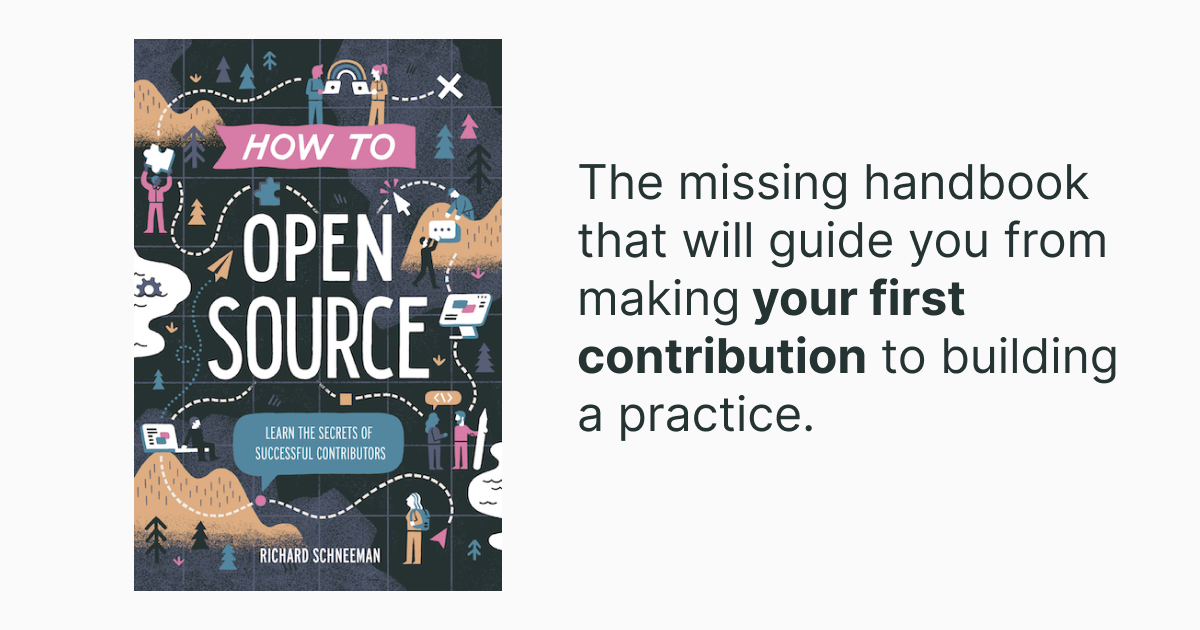
My book 'How to Open Source' launches today!
26 Sep 2022Today is the day. How to Open Source is now available for purchase at howtoopensource.dev.

Today is the day. How to Open Source is now available for purchase at howtoopensource.dev.

Today I’m going to share my perspective on how Ruby on Rails is developed and governed and how I feel the Basecamp “incident” impacts the future of Rails. I’m going to start out telling you what I know for sure, dip into some unknowns, and dive into some hypotheticals for fun.

TravisCI.org is dead. Long live the new CI! TravisCI.org was THE way to run CI for an open source Ruby library. It was so easy that it was seemingly effortless. Even better, it was free. Since the slow-motion collapse of the product, developers have been pushed to other CI providers. I was recently tasked with transferring CI away from Travis for my library derailed_benchmarks and chose CircleCI. This post is a little about why I chose CircleCI, a little about how the transition worked, and a little about nostalgia.

Have you ever hit an error that you just plain hate? Back in 2006, I was learning to program Ruby and following an example from a book. I typed in what I saw, hit enter, and ran into a supremely frustrating error message:

Contributing to open-source can be intimidating, especially when you’re getting started. In this post and video series, join me as I triage 11 issues on a repo that I didn’t create and don’t have much experience with.

Your app is slow. It does not spark joy. This post will show you how to use memory allocation profiling tools to discover performance hotspots, even when they’re coming from inside a library. We will use this technique with a real-world application to identify a piece of optimizable code in Active Record that ultimately leads to a patch with a substantial impact on page speed.

When API requests are made one-after-the-other they’ll quickly hit rate limits and when that happens:

In the beginning, there were API requests, and they were good. But then some jerk went and made too many requests too fast and brought the server crashing to its knees. Enter: Rate limiting.

I got a customer ticket the other day that said they weren’t worried about response time because “New Relic is showing our average response time to be sub 200ms”. Sounds good, right? Well, when it comes to performance - you can’t use the average if you don’t know the distribution. It’s usually best to use the median, which is also perc50, though you’ll also want to look at your long tail of responses. If you’re not following, then this post is for you.

I maintain an internal-facing service at Heroku that does metadata processing. It’s not real-time, so there’s plenty of slack for when things go wrong. Recently I discovered that the system was getting bogged down to the point where no jobs were being executed at all. After hours of debugging, I found the problem was an UPDATE on a single row on a single table was causing the entire table to lock, which caused a lock queue and ground the whole process to a halt. This post is a story about how the problem was debugged and fixed and why such a seemingly simple query caused so much harm.
